Ice ice baby!
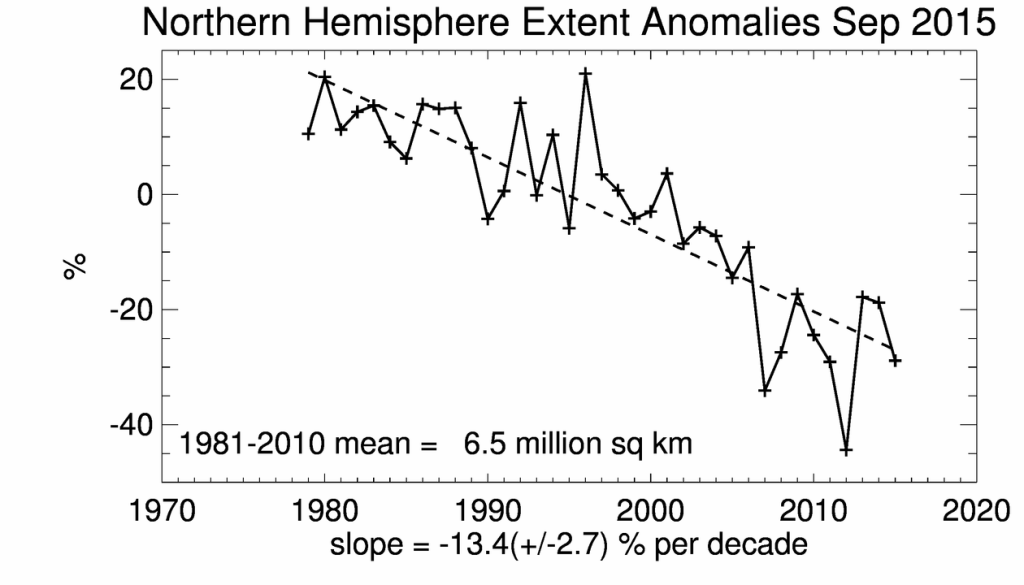
The National Snow and Ice Data Center in Boulder, Colorado has demonstrated how to construct an Arctic ice scam. The key feature of the scam is a graph like the one below, which necessarily starts in the Arctic record cold year of 1979, and appears to show a linear loss of sea ice headed towards zero.
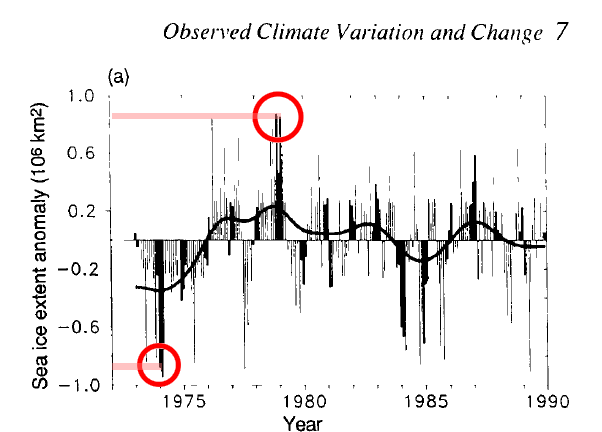
What you would not want to do is include the 1990 IPCC/NOAA Arctic sea ice data which shows that 1979 was a peak, and that 1974 had about 1.8 million km² less ice than 1979. that would wreck your linear trend scam.
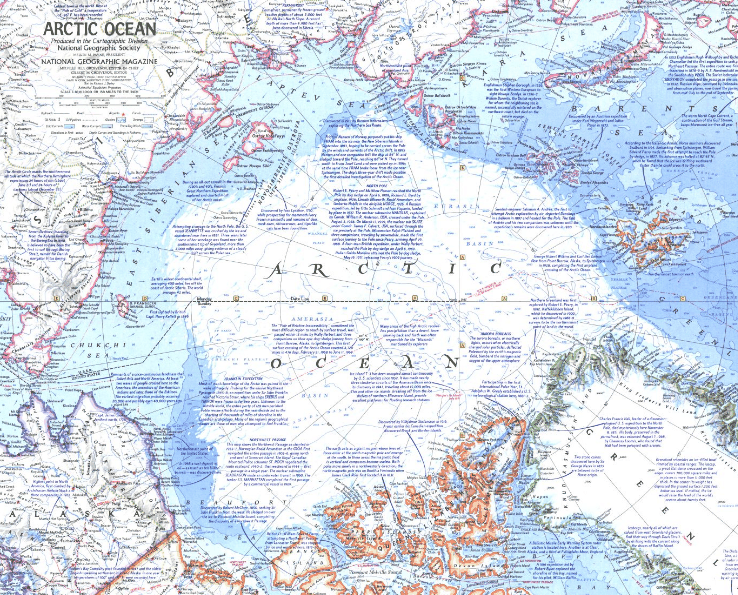
You would also not want to include this 1971 National Geographic map showing ice extent not terribly different from 2015.
The composite map below shows that ice extent in 1971 (brown) was much less than September, 1979 ice extent. It also shows that 1971 ice was much less than the NSIDC median…
View original post 141 more words


